---
📈 Dynamic Dashboards and Performance Monitoring
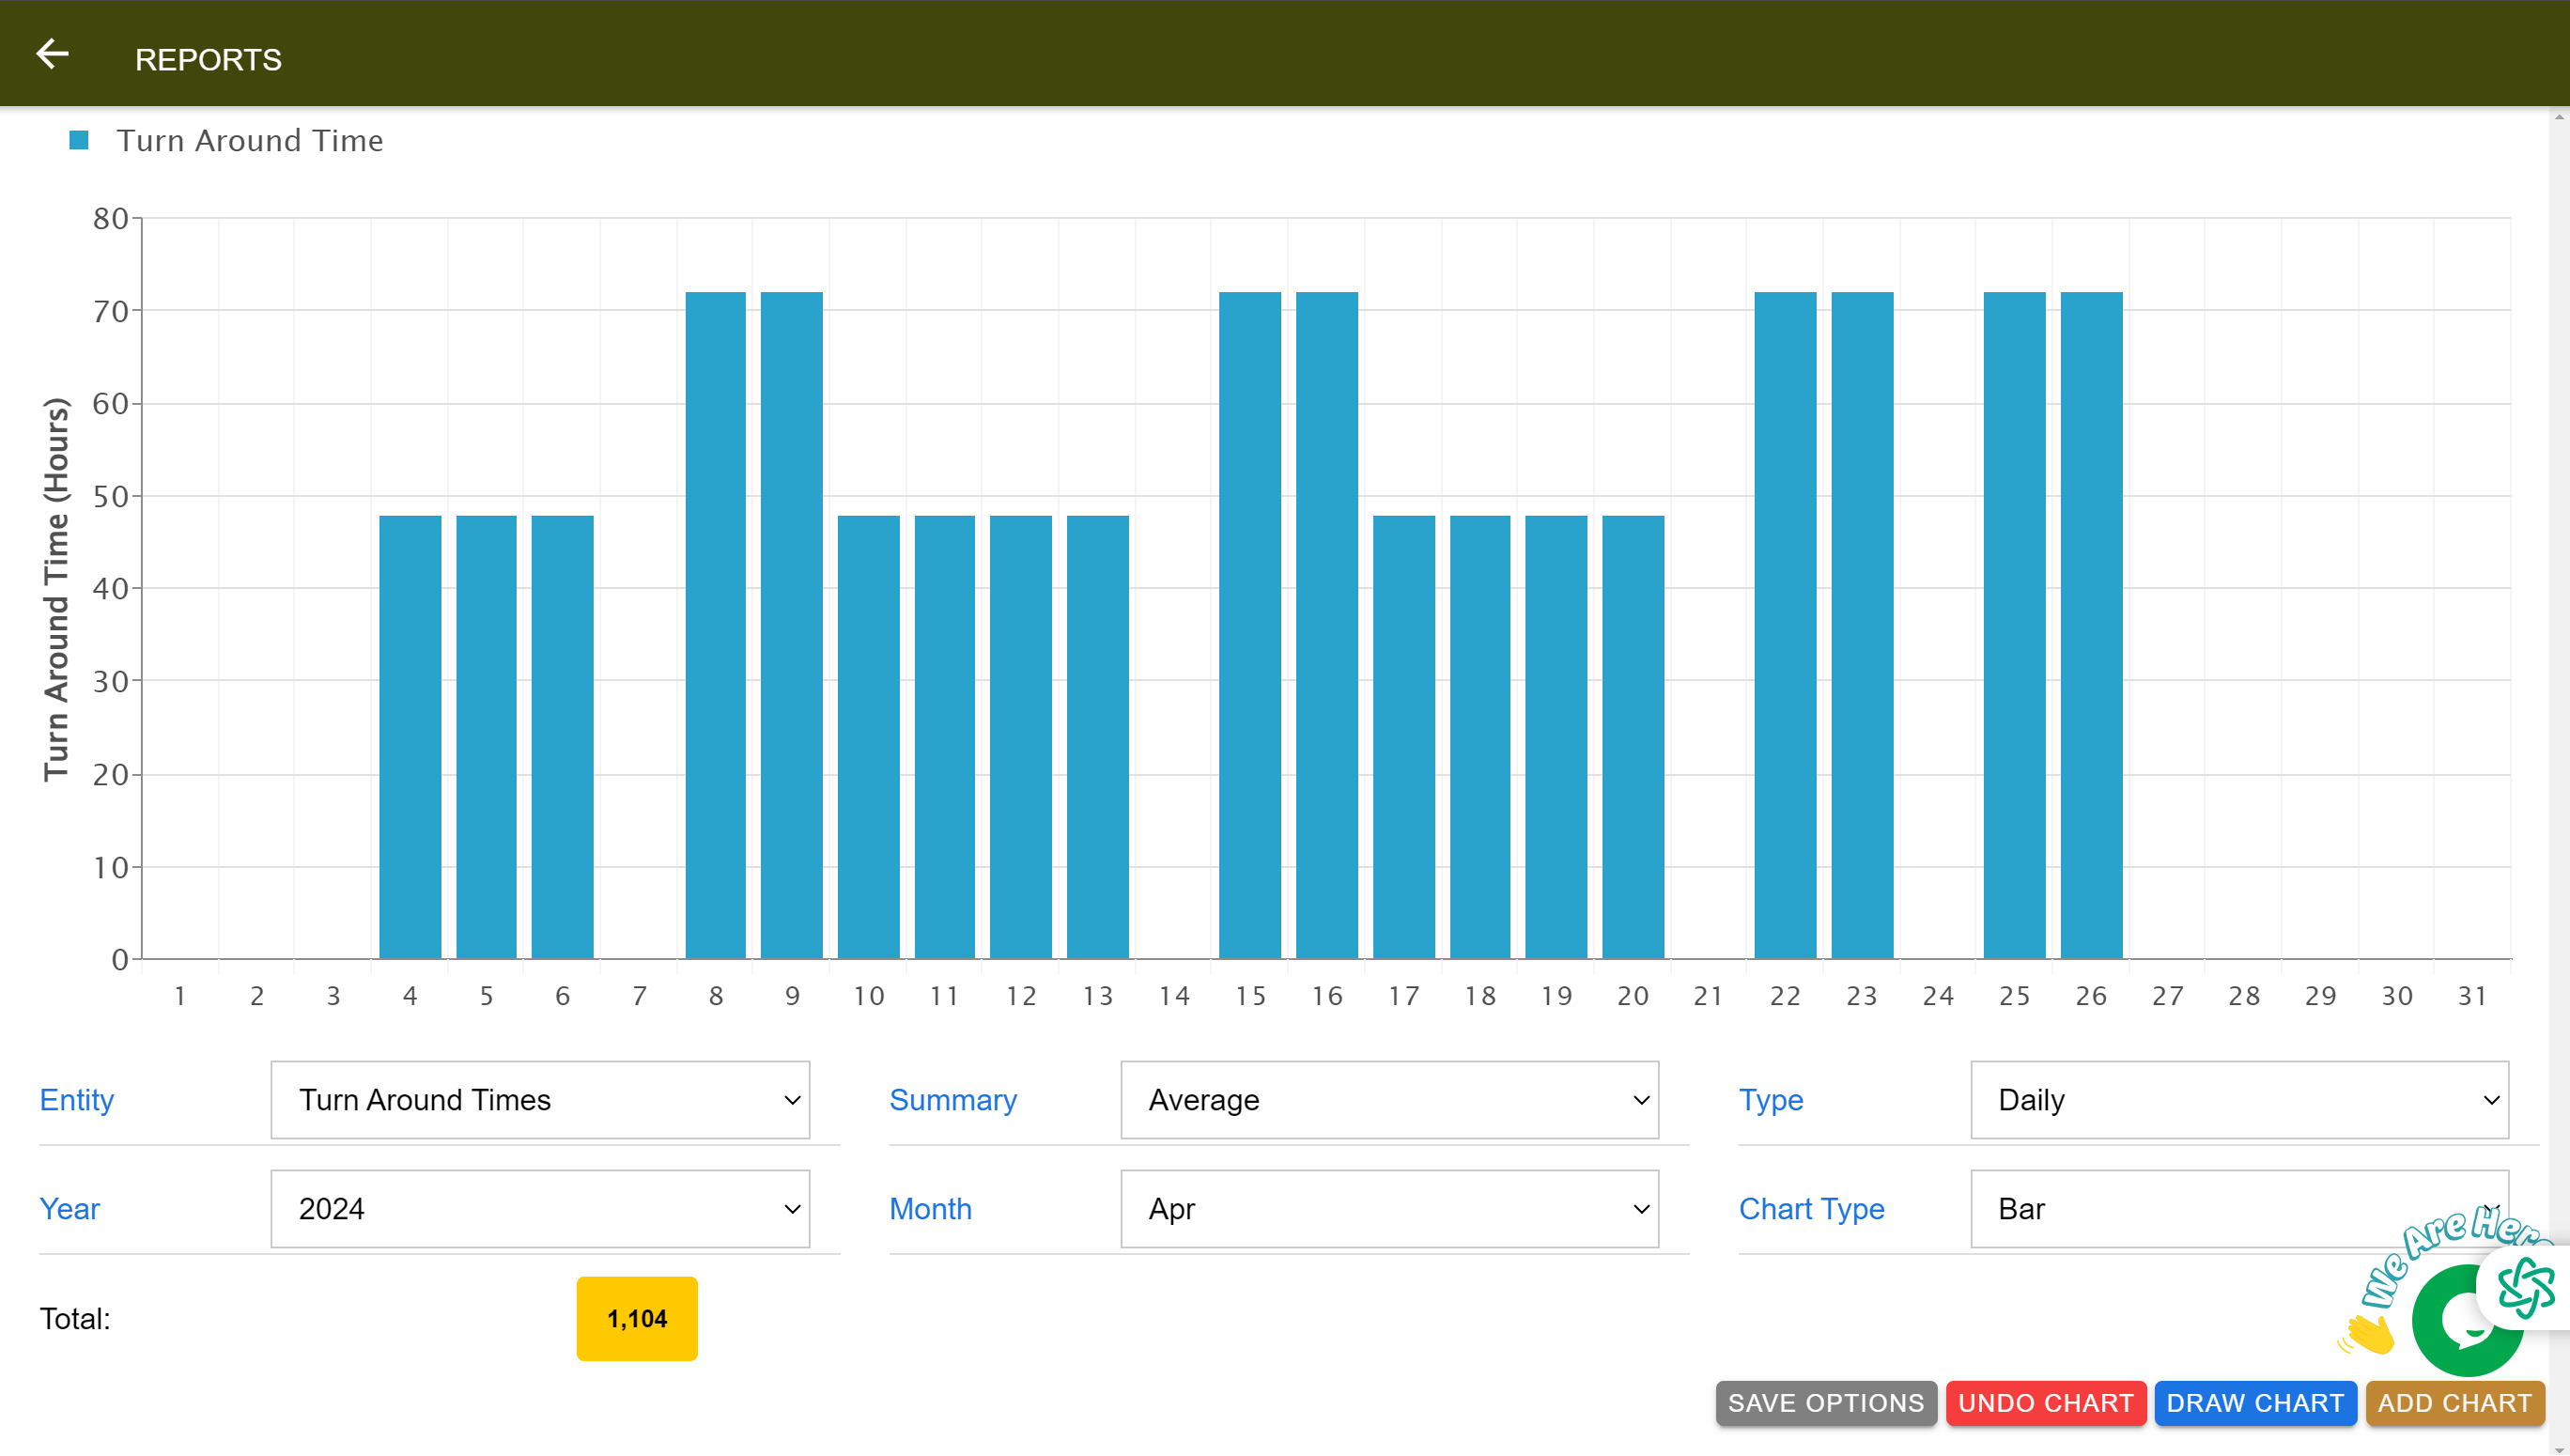
The Perfect Laboratory Manager includes a suite of real-time dashboards and visual analytics tools that empower lab managers to monitor key performance indicators (KPIs) and drive continuous improvement.
✨ Insights at Your Fingertips
- ⏱️ Turnaround Time (TAT): Track average time from specimen collection to result approval.
- 📊 Pending vs. Completed Tests: Monitor test workflows and identify bottlenecks.
- 🧪 Specimen Rejection Rates: Identify and resolve common issues with sample quality.
- 📅 Daily Sample Volumes: Measure lab throughput and peak activity periods.
🔎 Advanced Filtering Options
All metrics can be filtered by:
- 📅 Date ranges (Today, This Week, Custom)
- 🏥 Branch or laboratory location
- 👩🔬 Technician
- 🧪 Test type
This flexibility provides both high-level overviews and granular insights for effective decision-making.
💡
Tip:
Use dashboards to move from reactive problem-solving to proactive lab management and ensure consistent service quality.
---
📊 Dashboard KPIs
Dashboards include prebuilt and customizable key performance indicators such as:
- ✅ Average Turnaround Time
- ✅ Number of Tests Processed by Technician
- ✅ Top-Ordered Tests
- ✅ Revenue and Billing Trends
- ✅ Insurance Claim Reconciliation Status
These insights empower management to evaluate staff productivity, optimize workflows, and make evidence-based process improvements.